

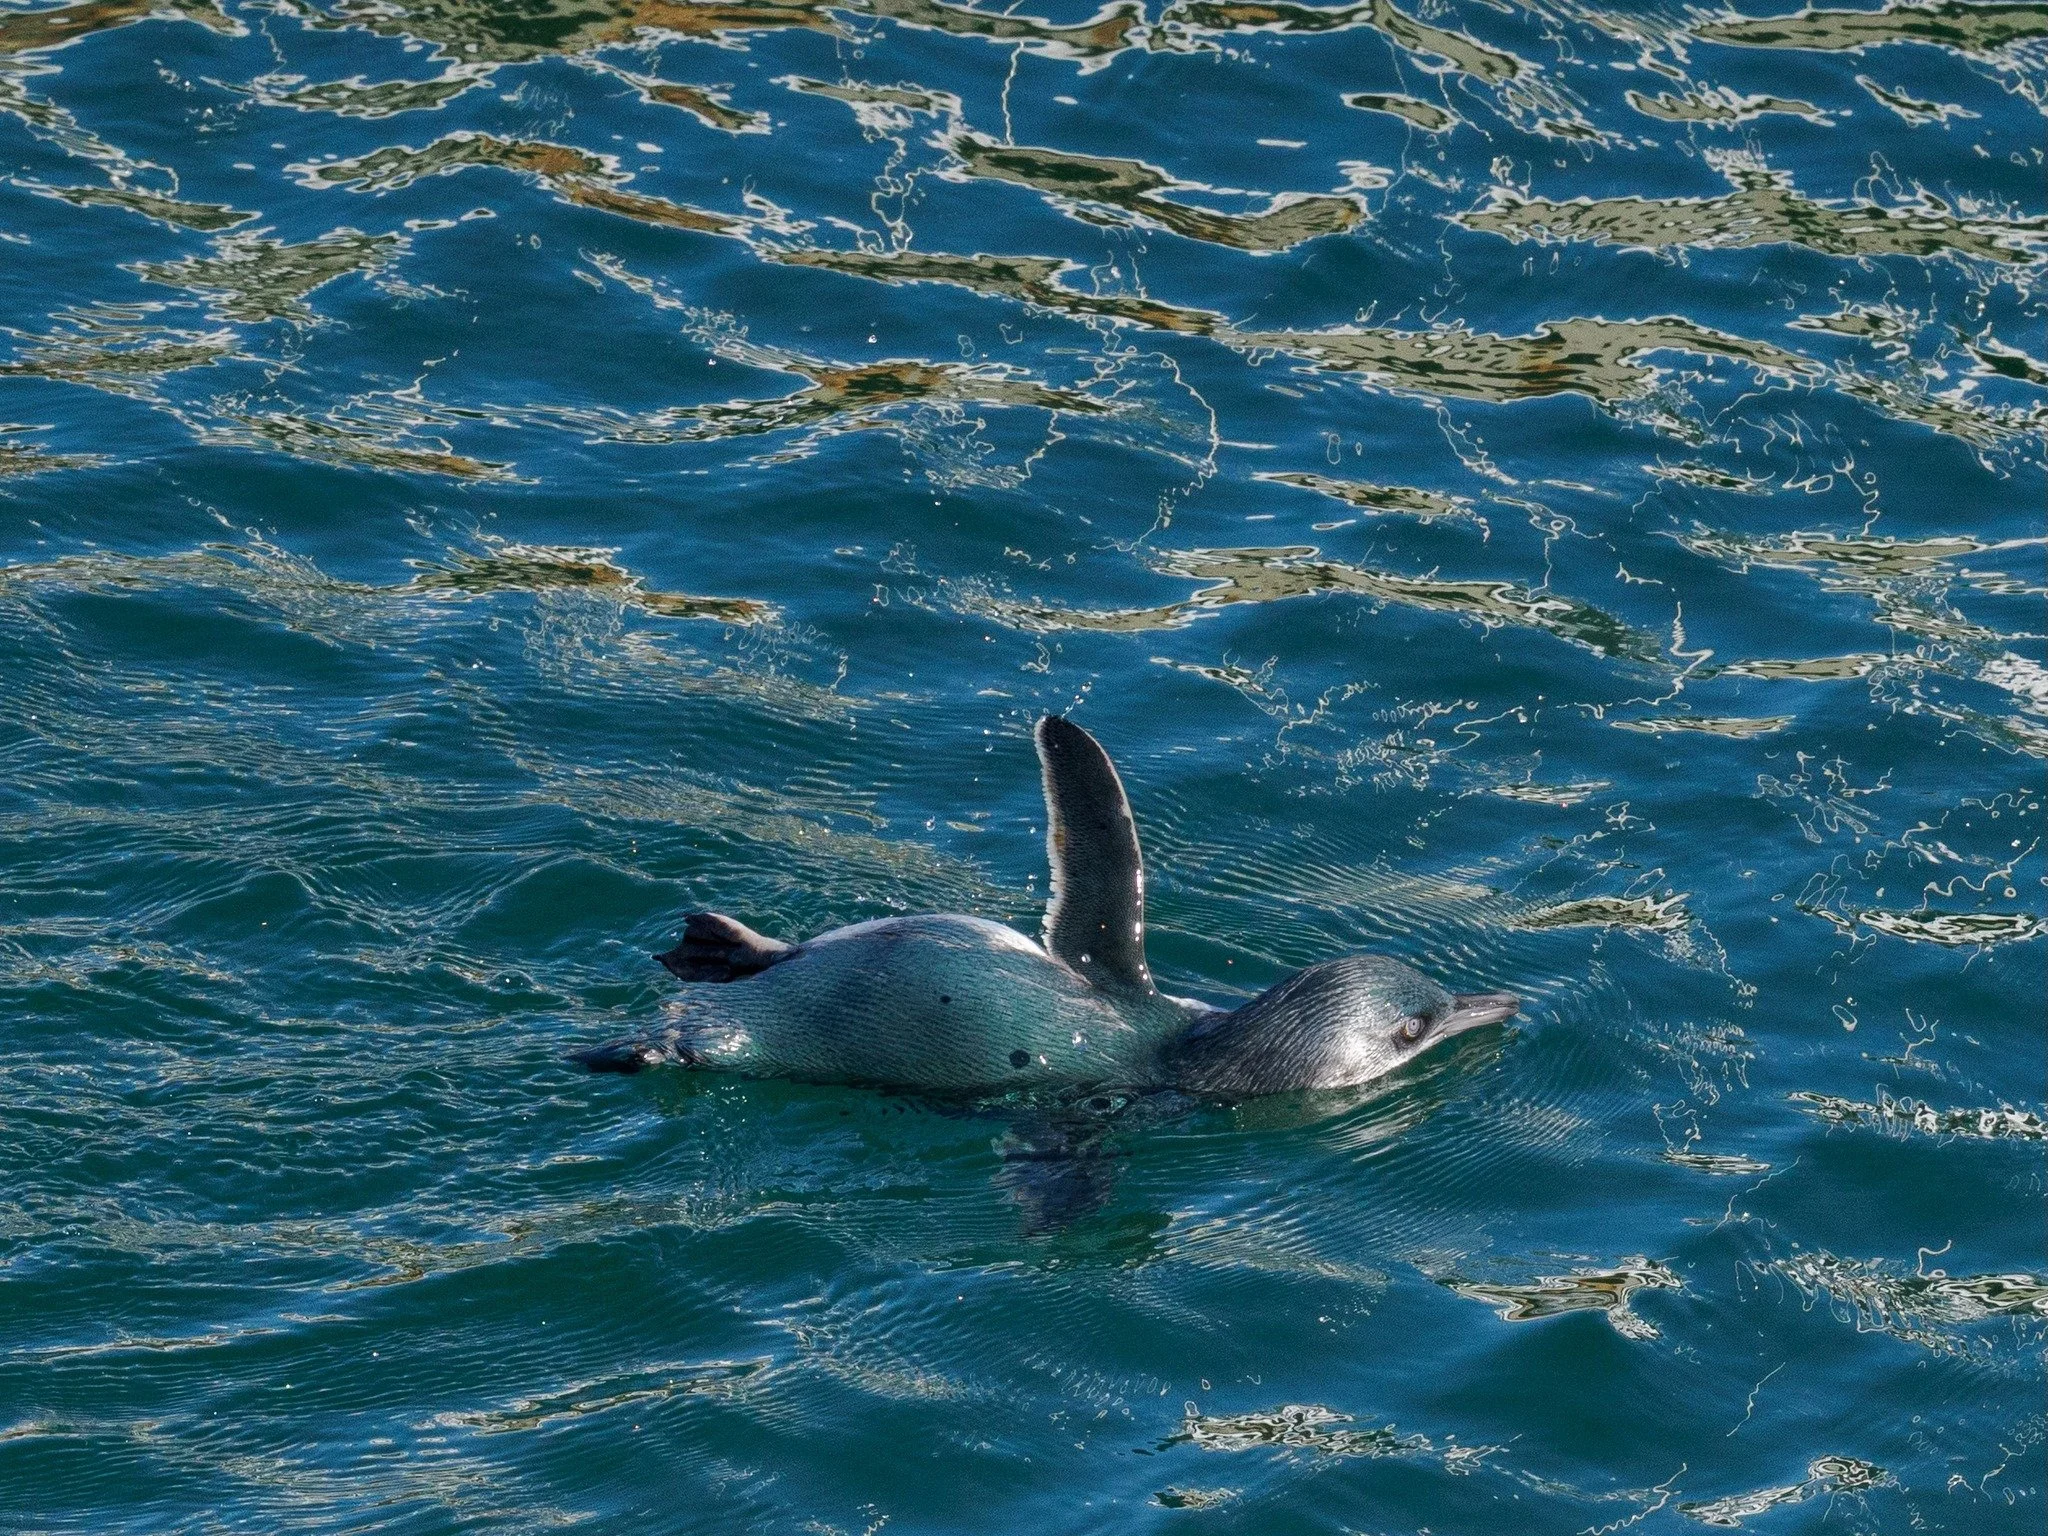
Kororā/Little Penguin National Diet Study
Image credit: Jonathan Mower
About the study
We have embarked on a nationwide DNA study of kororā/little penguin scat (penguin poo) to determine what they eat, what diseases they have and parasites they might carry. These are expected to differ from place to place and throughout the year, as well as between years.
It is a long-term study funded by the New Zealand Penguin Initiative and in collaboration with groups throughout the country who devote their time to collecting scat samples on a seasonal basis. The samples are processed and sent to Wilderlab for analysis. The samples also provide the opportunity to investigate diseases and parasites, in future.
Why is this important?
Understanding diet is an essential component to ensuring effective species management. Without adequate food supply, the population is at risk of decline due to low adult survival, reduced breeding success and low recruitment of young into the breeding population. Kororā populations have faced an increased frequency of starvation events over recent years, when large numbers of starving or dead individuals are found ashore on beaches. Lower breeding success is reported with eggs/chicks found abandoned and adults failing to survive their annual moult.
Diet is important because death through starvation occurs periodically, most recently in Northland with over 100 kororā found dead (as reported by The Northern Advocate on 12 June 2022). To understand the causes of starvation events it is vital to know about their diet and seasonal and annual changes in different parts of the country.
What do we know?
Diet studies of kororā in New Zealand identifying the hard parts of prey species from stomach contents so far only covered the South Island south of Banks Peninsula. The diet comprised of small pelagic fish (less than 15cm). In Stewart Island the diet primarily (> 10% weight contribution) consisted of Sprat, Arrow squid, Ahuru, Red cod, Hoki and Octopus (van Heezik 1990, Flemming et al. 2013). In Oamaru the diet consisted of Sprat, Graham’s gudgeon and Arrow squid (Fraser and Lalas 2004, Flemming et al.2013). At Banks Peninsula the diet consisted of Arrow squid, Red cod, Sprat and Ahuru (Flemming et al.2013). To date no diet study from stomach contents or DNA in scats have been done or reported from north of Banks Peninsula.
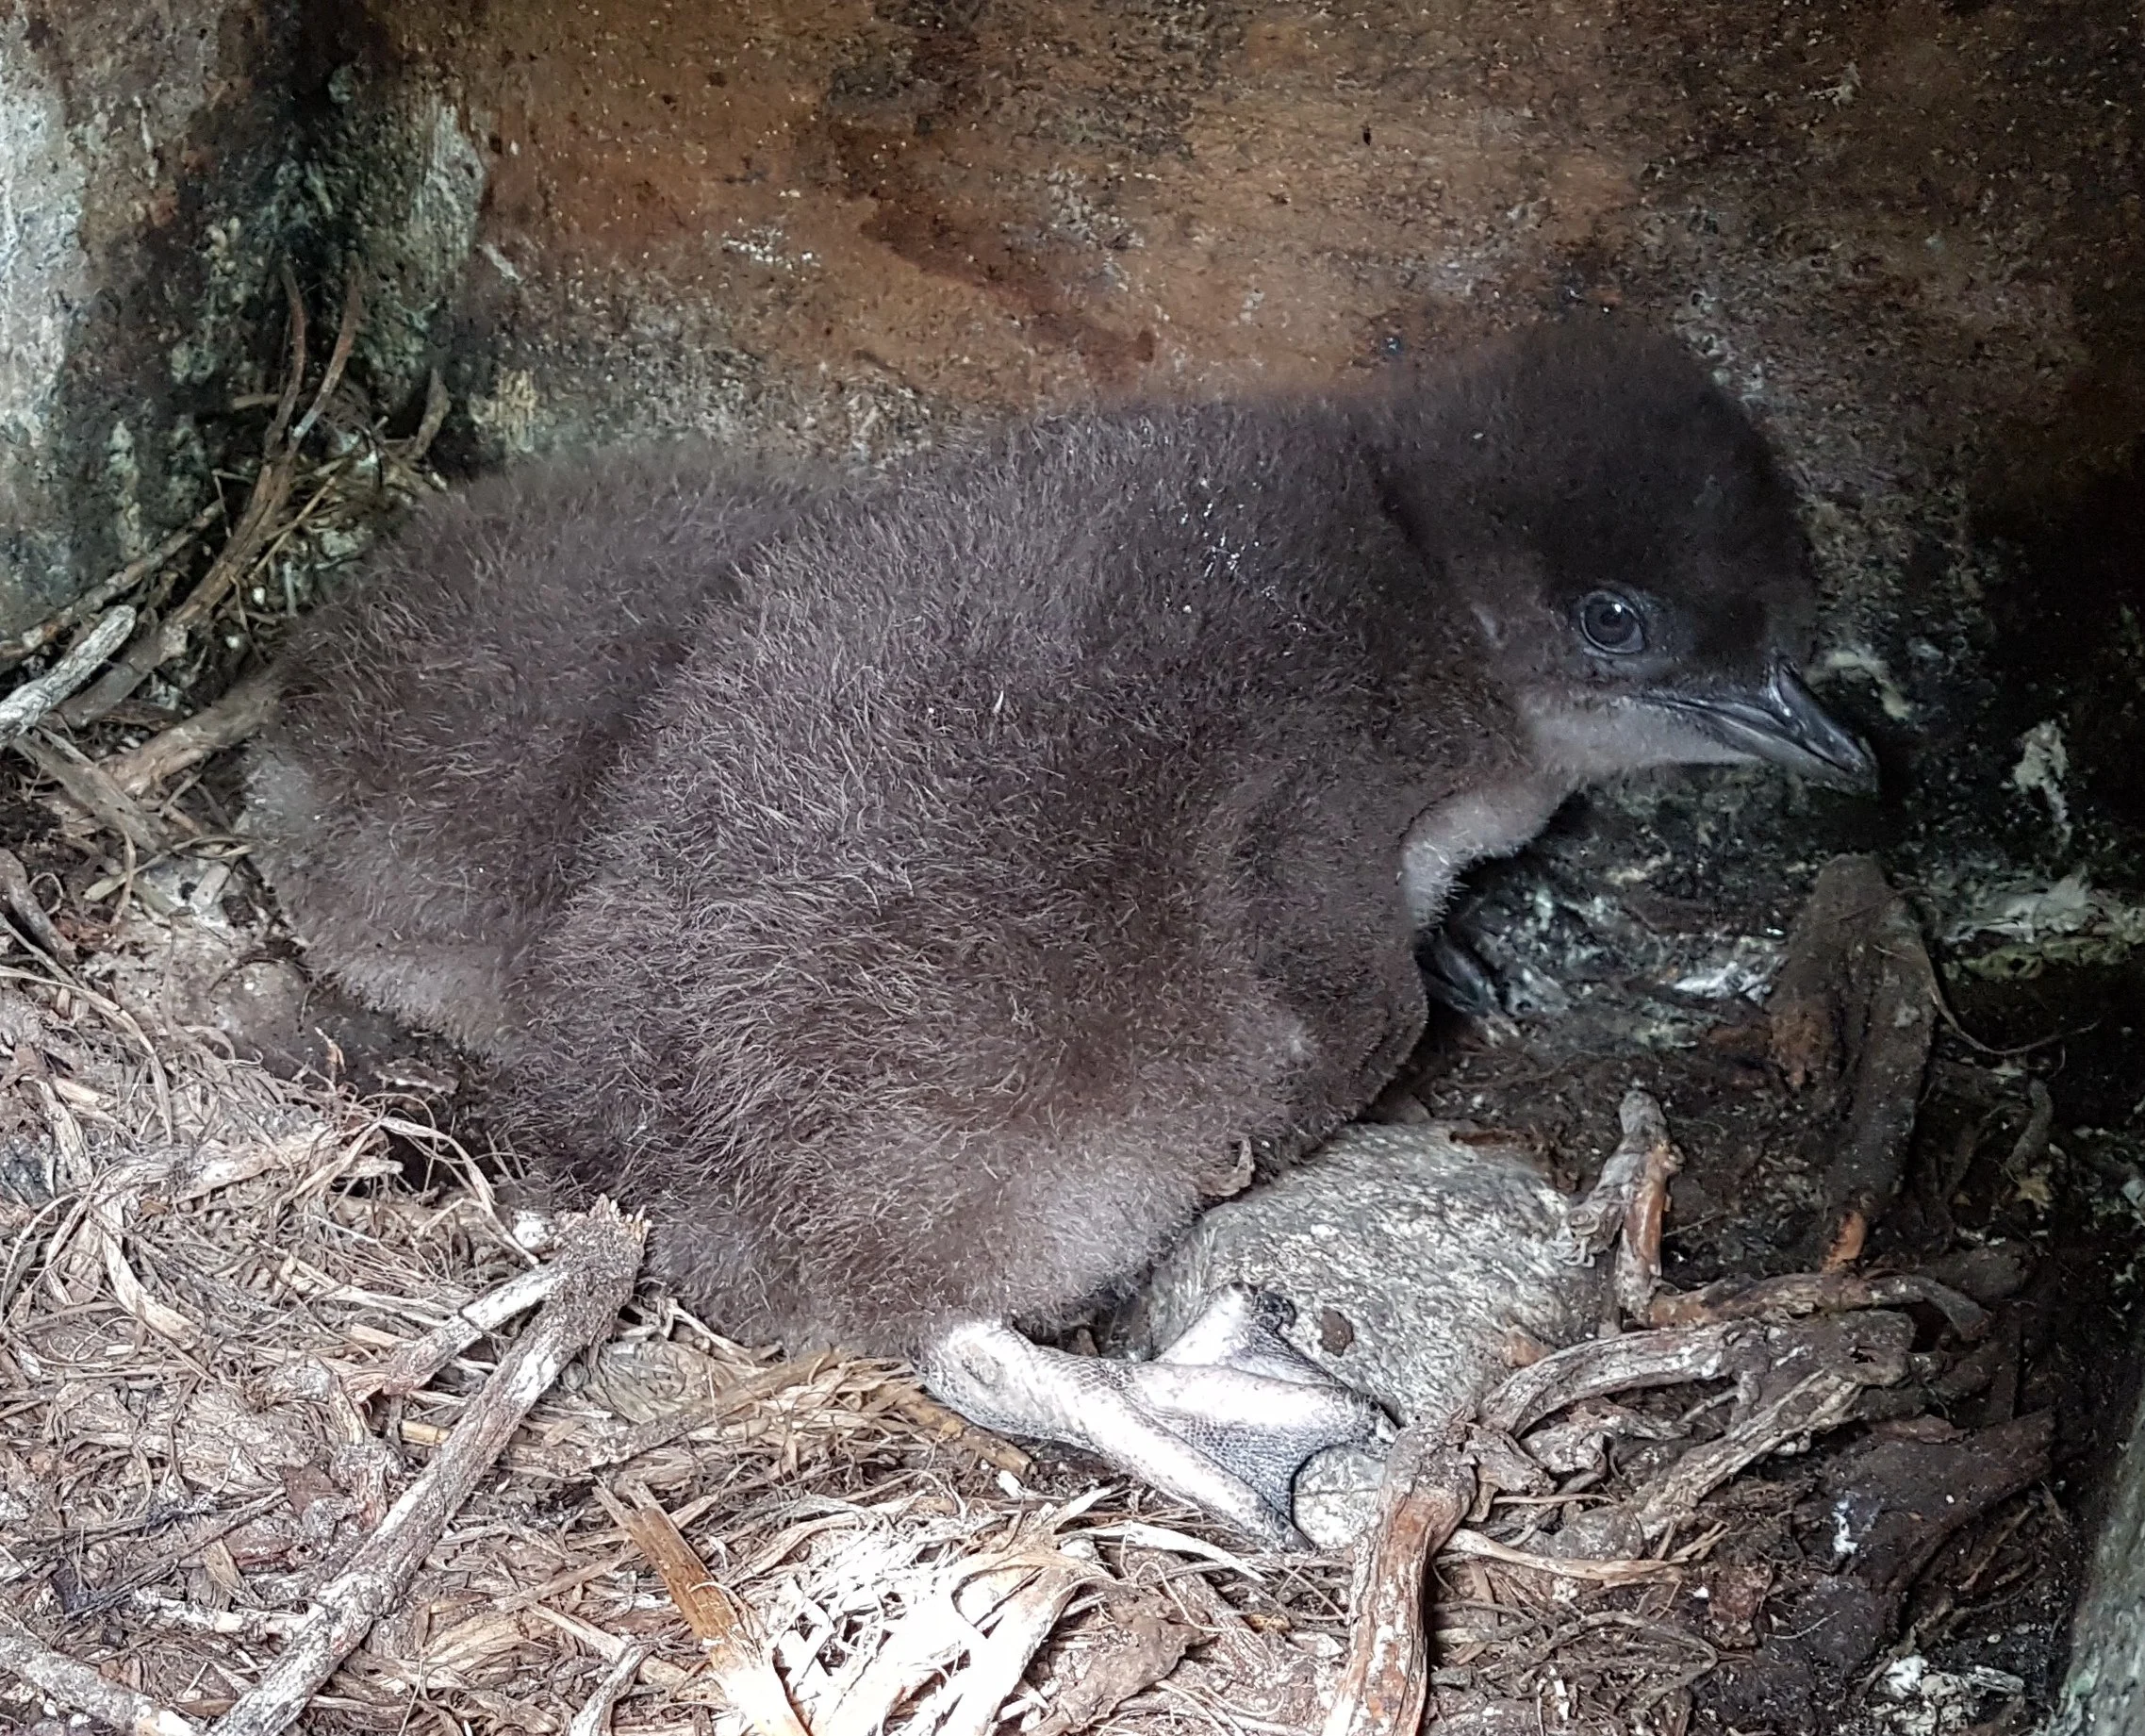
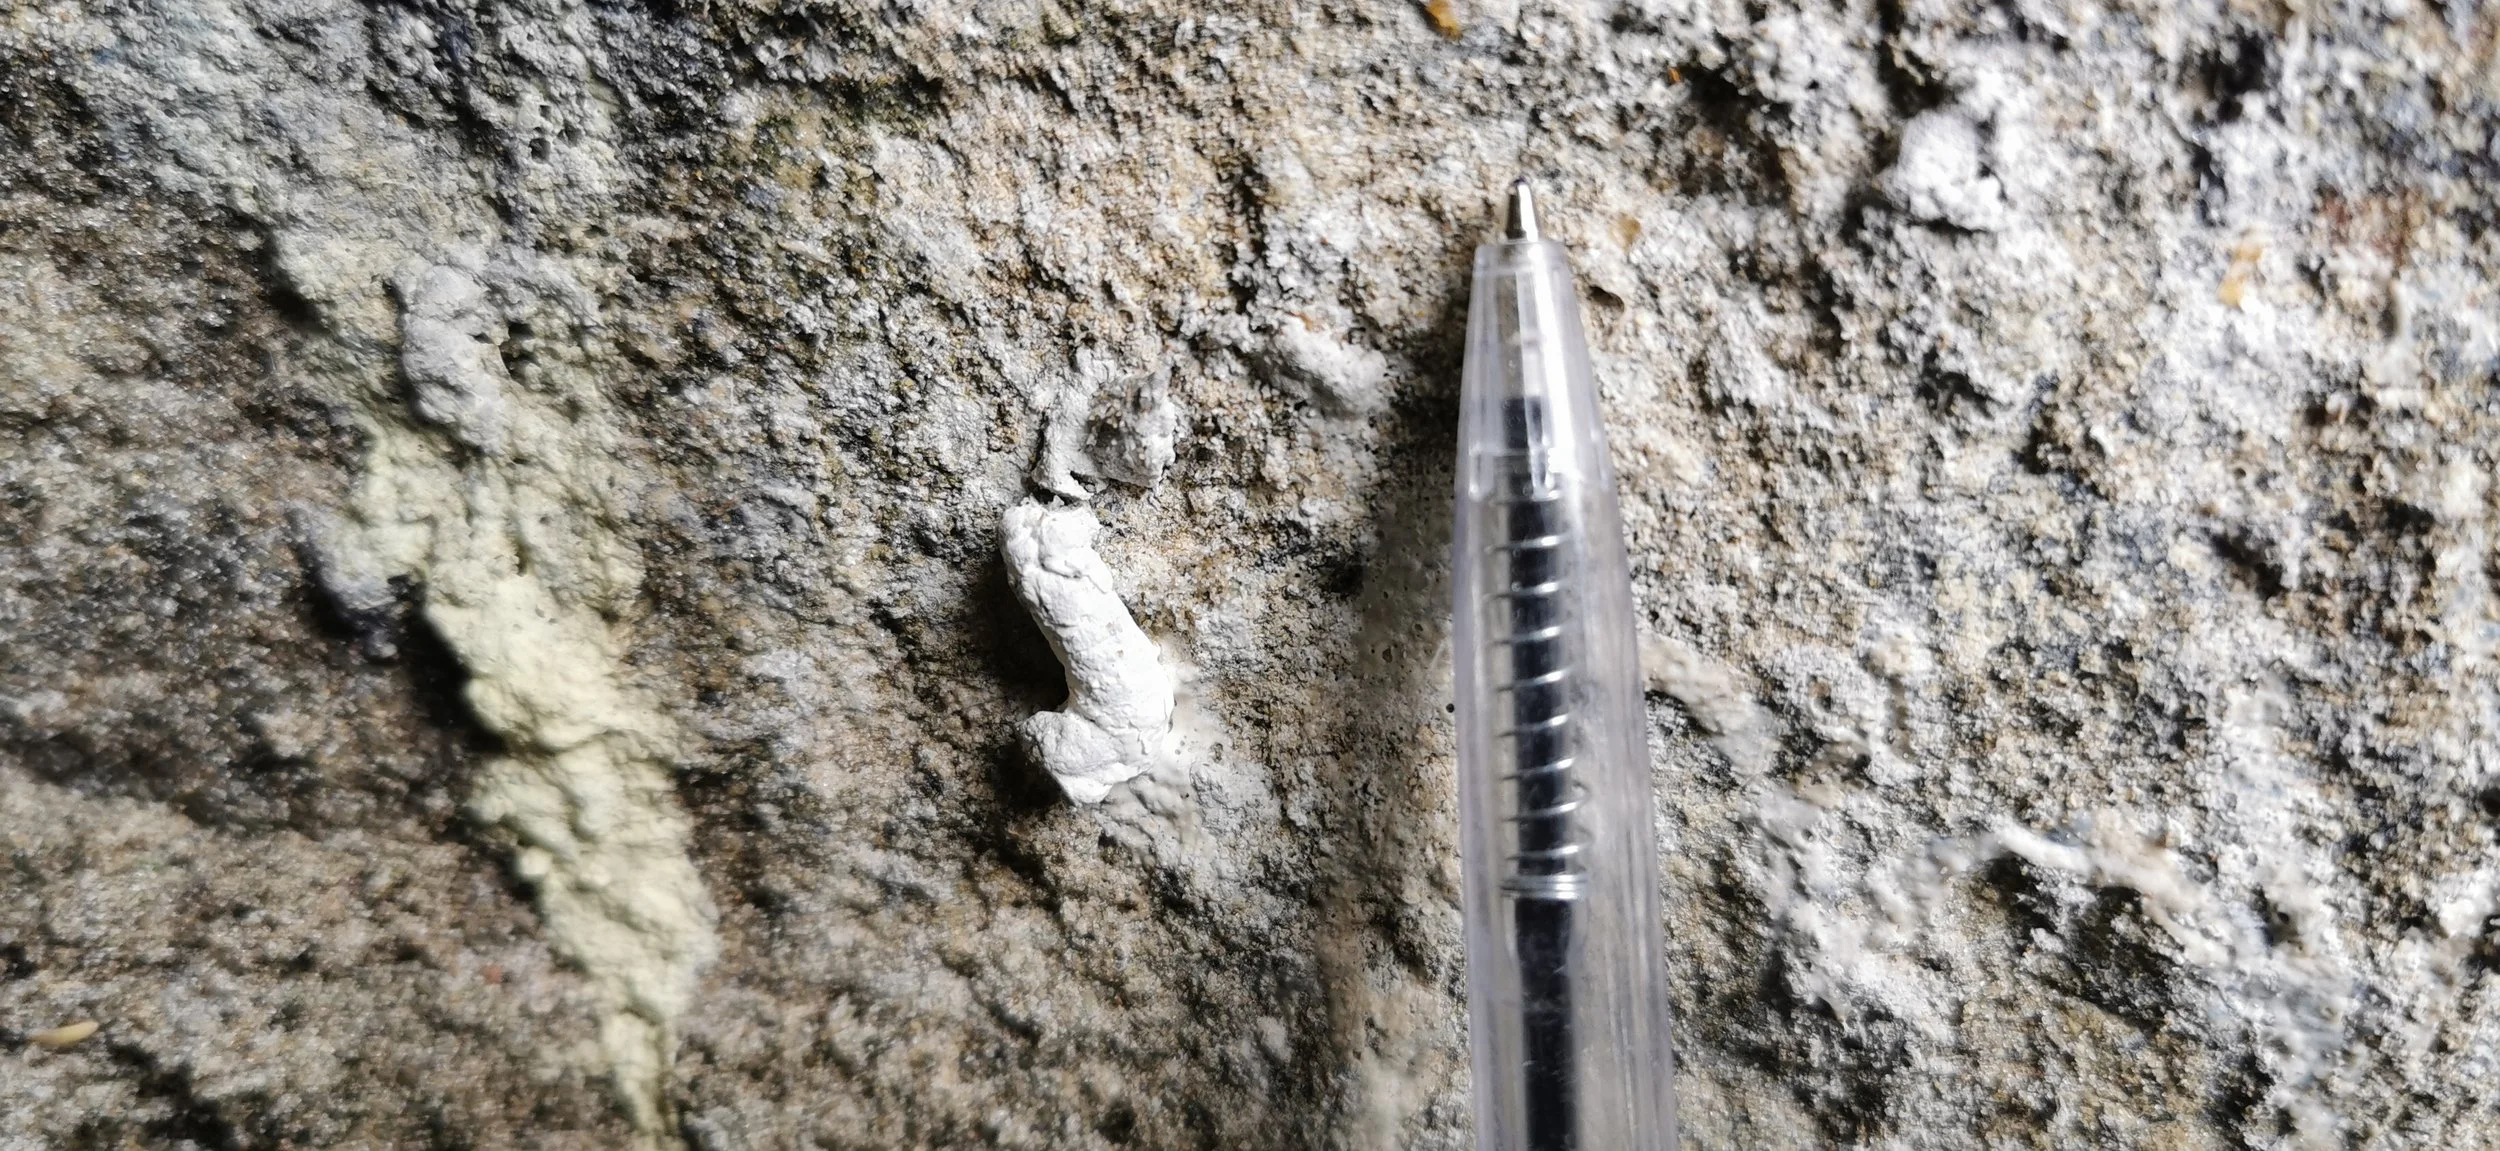
Samples are collected from nest boxes - preferably off hard surfaces - or roosting places. Silvery scat is best as it contains much prey DNA.
References:
Fleming SA, Lalas C and van Heezik Y 2013. Little penguins (Eudyptula minor) diet at three breeding colonies in New Zealand. New Zealand Journal of Ecology 37(2):199-205. Little penguin (Eudyptula minor) diet at three breeding colonies in New Zealand | NZES
Fraser MM and Lalas C 2004. Seasonal variation in the diet of blue penguins (Eudyptula minor) at Oamaru. Notornis 51:7-15. Seasonal variation in the diet of blue penguins ( Eudyptula minor ) at Oamaru, New Zealand
van Heezik Y 1990. Diets of yellow-eyed, Fiordland crested, and little blue penguins breeding sympatrically on Codfish Island, New Zealand. NZ Journal of Zoology 17(4):543-548. http://dx.doi.org/10.1080/03014223.1990.10422952
Methods
The analysis of DNA from scats is now an established methodology to determine diet composition, disease and parasites in penguins (Deagle et al. 2010, Young et al. 2020). Advances on DNA sequencing technology relate the relative read abundance (RRA: represents the amount of DNA recorded for each species) information to the proportion of species (prey, pathogens and parasites) where the proportion of RRA of a species relates to the percentage mass (Deagle et al. 2019). This method can be used to determine diet, diseases and parasites in penguins with negligible disturbance allowing for replication across breeding regions and at different times of the year (Young et al. 2020).
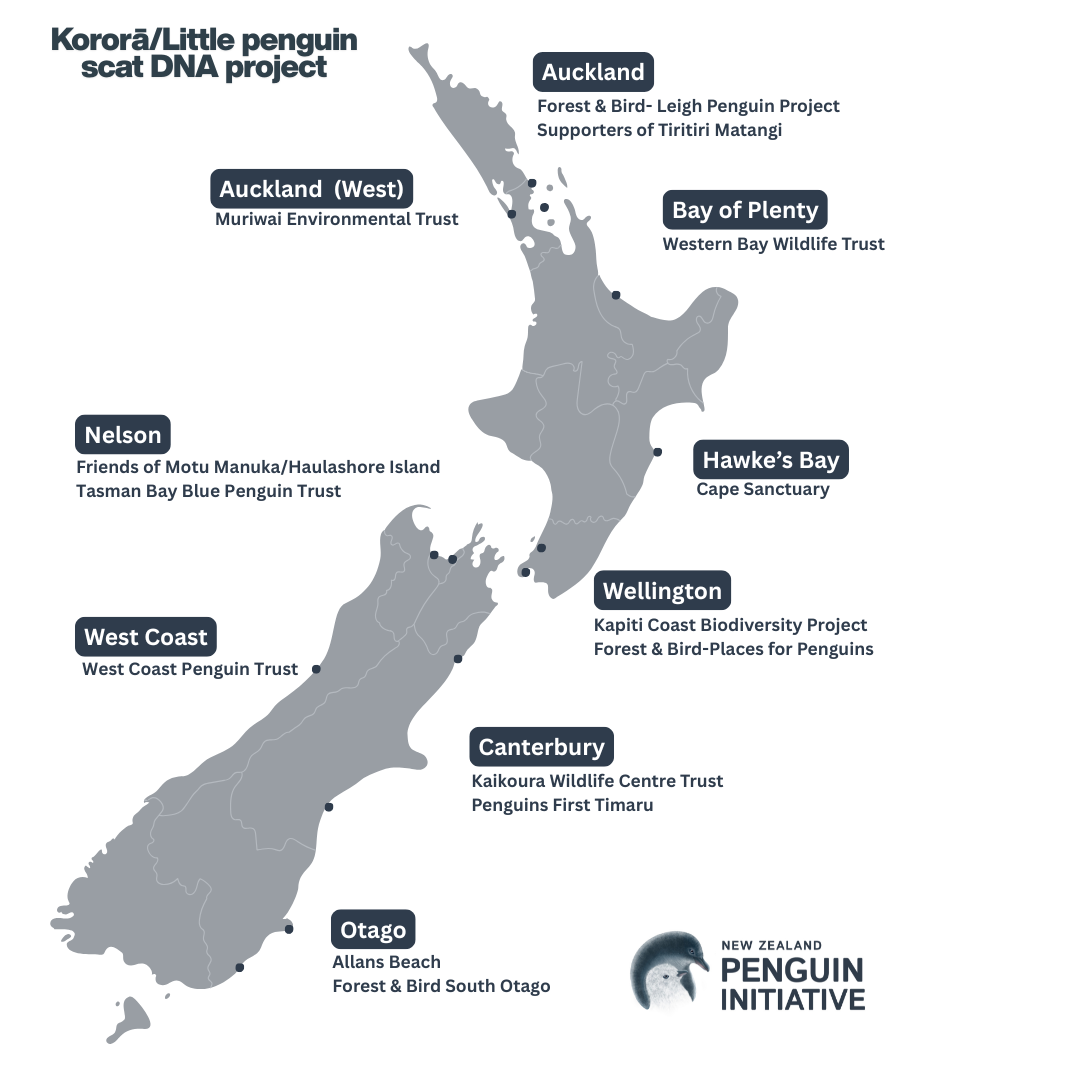
Participating groups
The samples were collected by community groups/organisations in and around their kororā breeding colonies, from inside nest boxes, natural burrows and roosting sites. These are sent to Wilderlab NZ Ltd for analysis and the results were collated and interpreted by the Penguin Initiative.
References:
Deagle et al. 2010. Pyrosequencing faecal DNA to determine diet of little penguins: is what goes in what comes out? Conservation Genetics 11:2039-2048. DOI 10.1007/s10592-010-0096-6
Deagle et al. 2019. Counting with DNA in metabarcoding studies: How should we convert sequence reads to dietary data. Molecular Ecology 28:391-406. DOI: 10.1111/mec.14734
Young et al. 2020. Species in the faeces: DNA metabarcoding as a method to determine the diet of the endangered yellow-eyed penguin. Wildlife Research 47:509-522. doi.org/10.1071/WR19246
Results
The scat is analyzed in a laboratory, and the results are presented as a “sequence count” that is a short stretch of DNA which can be used to identify different taxa. The scat DNA is matched against the known DNA from fishes, mollusks, and crustaceans, identifying what is present in the scat.
Identification can be to species, but also genus, family, class, and phylum. For example, Anchovies are Engraulis australis (species), but the analysis also provided the presence of (just) Engraulis (genus). As there is only one species in this genus, the sequence counts were combined.
This was applied to some other species but not others as it became complicated. Taxonomic classifications from different sources are complex and can be inconsistent, and here the results are simplified to provide an overview of the diet without going into too much detail that is confused by taxonomic contradictions.
Species can be taken as primary prey (taken directly by kororā) or secondary prey (taken by prey that is then consumed by kororā). There is no way to determine whether the prey found in the scat is primary or secondary. In many cases, the adult fish are too large for kororā to eat, and they are likely to target the juvenile fish that often occur in midwater (pelagic).
Fish families and names follow taxonomic order and are based on Roberts et al. 2015. Fish photos are sourced from McMillan et al. 2019 and Roberts et al. 2015.
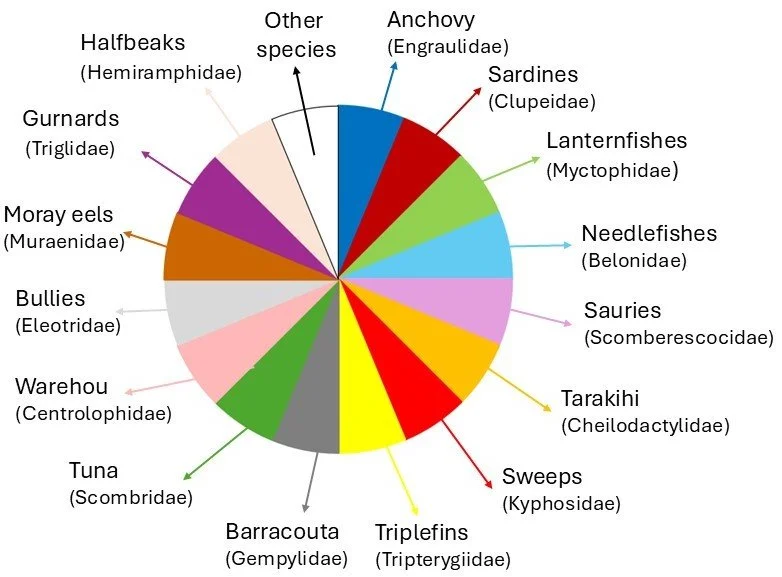
Colours representing fish families that had at least 10% RRA of DNA in any scat sample from any location. These colours correspond to those in the pie charts representing fish families found at each location.
References:
Roberts CD, Stewart AL and Struther CD (eds) 2015. The Fishes of New Zealand. In 4 volumes. Te Papa Press, Wellington. 2008p.
McMillan et al. 2019. New Zealand fishes. A field guide to common species caught by bottom, midwater, and surface fishing. New Zealand Aquatic Environment and Biodiversity Report No. 208. https://webstatic.niwa.co.nz/library/NZAEBR-208.pdf
Results by location
The accordion below presents the results by colony. Click on the locations to learn about the diet at each location through the seasons.
Results by season
The accordion below presents the results by season and some highlights and unexpected results.
Click on the season to learn about how the diet differs within each season around the country.
It’s all about the fish
The scat samples are analysed and the results are presented as a sequence count that is a short stretch of DNA that is used to identify different taxa. The scat DNA is matched against the known DNA from fishes, mollusks, and crustaceans, identifying what is present in the scat. Identification can be to species, but also genus, family, class, and phylum.
The results of the samples are examined and presented in a pie chart by fish families that had at least 10% Relative Read Abundance (RRA) of fish and non-fish DNA in any scat sample from any location. Each chart has also got a white slice that represents all the other species that were recorded at less than 10%.
So far 15 fish families have been recorded at >10% RRA, and the colours in the pie chart here correspond to the colours found in the pie charts from each location and season. Here, a brief description of each family can be found in the accordions below.
It is important to keep in mind that pelagic (mid-water) youngsters of most of the species in these families are consumed by the penguins, probably up to a 12cm in size and living in the top 20m of the ocean.